QC on Optimization Results
The RapidPipeline cloud interface will perform automated quality assurance whenever an asset is processed with an Action or a Preset. These tools provide quantitative evaluation of your output models, with evaluation scores and rendered image comparisons.
Open the Quality Report for Processed Outputs
To see the quality control information:
Process an uploaded 3D model with an Action or a Preset.
Expand the asset listing by clicking on the arrow to the left of the asset name.
Look for the rows under 3D Processor Output Models then click on the Quality Control magnifier icon button.
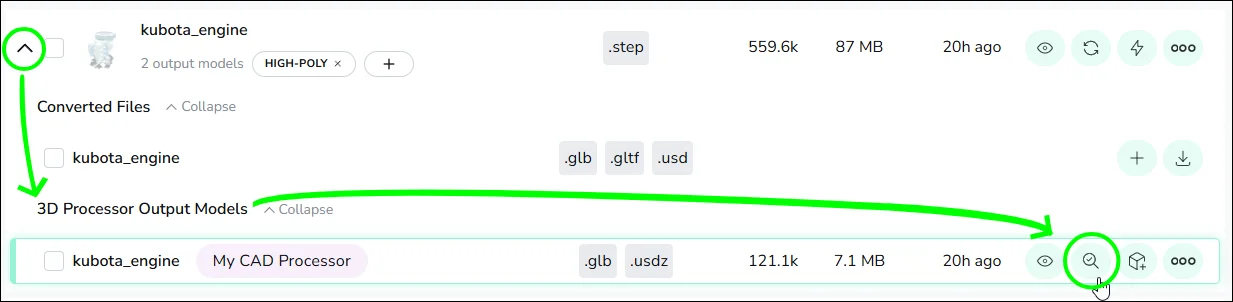
- The magnifier button is also available inside the Preview display, in the top right corner.

The Quality Report
The Quality Report provides quantitative evaluation of your output models, with evaluation scores and rendered image comparisons.
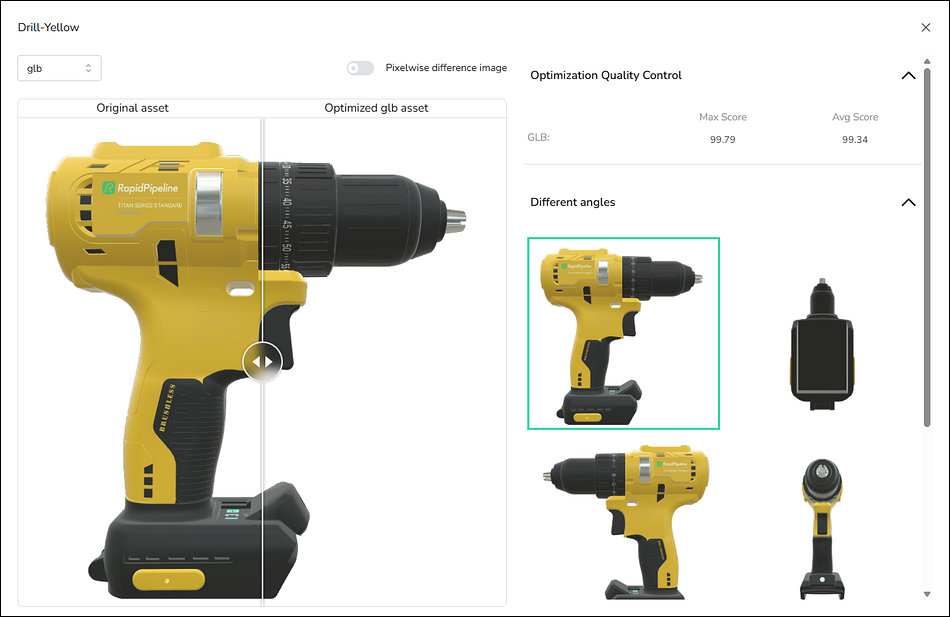
Use the A/B Slider to compare the input asset with the output model.
Use the Model Dropdown at top left to switch between output models, replacing the model on the right side of the A/B slider.
Enable the Pixelwise difference image to highlight in red any differences between the two models.
Evaluation scores are shown at upper right. These provide a quantitative measure of the output model's quality, based on its visual similarity to the input model.
- Maximum Score is the highest similarity percentage for any of the 6 renders for that particular format.
- Average Score is the weighted average score of all 6 renders of that particular format.
Choose any of the six Different angles to compare various views of the two models.
All versions of the asset are rendered with RapidPipeline's own PBR renderer. When the Original Asset is a CAD model, renders use the tessellated version of the CAD file.
Currently a Quality Report is not available for assets uploaded using the cloud version of the RapidPipeline DCC Importer.
A more comprehensive Quality Report can be generated by using the RapidPipeline QC Tools CLI.
If using the API, a Quality Report is automatically generated whenever the Optimize endpoint is called for a source asset, and can be readily accessed with a downloadQc call.
Preview - Comparison Mode
The Comparison Mode switch in the Preview display shows the input and output models side-by-side in a real-time 3D view.
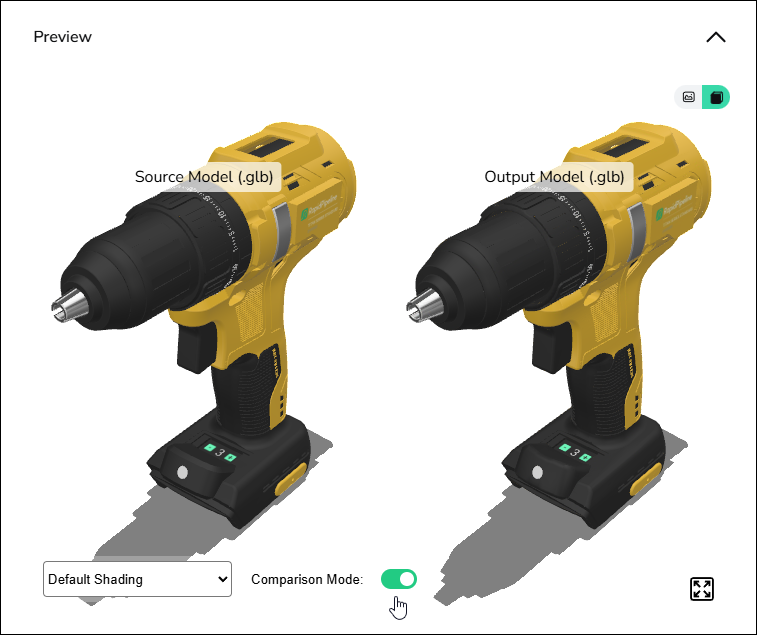
This allows a detailed real-time examination of the two models, from any angle.
- Left mouse drag = rotate
- Right mouse drag = pan
- Middle mouse wheel = zoom
Use the rendering options dropdown at bottom left (Default Shading) to compare different material channels, including Wireframe and UV Coordinates modes!
After examining the quality comparisons, it's time to learn about Importing a Preset!